A history of Canada’s full-time faculty in six charts
A look at some UCASS data from 1970 to 2016.
Last year, Statistics Canada released University and College Academic Staff System survey data for the first time in five years. (The survey had been scrapped in 2012 and revived in 2016.) This data on full-time faculty at 112 universities and colleges offers an important snapshot of Canada’s professoriate (read more about the latest results here).
The UCASS survey goes back to 1937, but 1970 is the earliest date for a continuous time series. University Affairs took a closer look at this data, starting from 1970, and the resulting six charts tell a partial history of Canada’s full-time faculty over nearly five decades (no data was available from 2011 to 2015 while UCASS was on hiatus).
Hover over each graph to see the numbers in more detail. And note that the dates listed represent academic years (e.g. 2016-17, 1970-71) rather than calendar years.
[visualizer id=”45238″]
While female faculty members may have been a rarity back when the survey started in 1937, the number of women in the professoriate steadily grew throughout the last 47 years (see Figure 1). In 1970, women made up 13 percent of total full-time faculty (there were 3,138 female professors out of a total 24,597 faculty). By 2016, women made up 40 percent of total full-time faculty members (18,099 women out of a total of 45,660 faculty).
[visualizer id=”45031″]
In terms of gender and salary (Figure 2), although women are increasingly represented in the professoriate, men remain its top earners. The gap in median salary between men and women (in constant, inflation-adjusted dollars) was widest in 1990, when men earned around 25 percent more than women. However, the latest UCASS data show women are closing the pay gap: the median salary for men in 2016 was $136,844 while women earned $121,872 – a gap of about 12 percent.
Professional rank may provide context for this difference in pay (Figure 3).
[visualizer id=”45028″]
Men overwhelmingly dominate the ranks of full and associate professors in Canada, and thus the highest paid jobs in the country’s professoriate – a fact that hasn’t changed in more than four decades. (Note, in Figure 3, that the number of male full professors in Canada peaked at 13,387 – or 91 percent of all full professors – in 1992, around the same time that the pay gap was at its widest.) The shrinking of the pay gap between men and women over the past decade may correspond to an increase in women in the ranks of full professor and associate professor during that same time.
[visualizer id=”45027″]
In Figure 4, there are a few interesting trends between the ranks of full professor, associate professor and assistant professor. For example, from 1972 to 1994, you can seemingly follow a cohort of assistant professors as they go up the ranks of tenure throughout their careers. (A cohort that is largely male, according to Figure 3.)
In 1972 there are 9,494 assistant professors (85 percent of these are male) and 5,743 full professors (96 percent male), 7,979 associate professors (91 percent male).
Twelve years later, in 1984, the number of assistant professors drops by about 30 percent while the number of associate professors jumps about 61 percent. By 1994, a decade after that first peak in the associate professor ranks and more than 20 years after that cohort of assistant professors presumably got on the tenure-track in 1972, the number of full professors reached 14,854 (89 percent male) – an all-time high for full professors that would not be unseated until 2010, when it reached 14,946 (77 percent male). In 2016, the number of full professors was 16,239 (72 percent male) while associate professors clocked in at an all-time high of 16,272 (about 57 percent male).
As the number of female professors increased over the last decade, a similar “cycling” through the ranks seems to have begun for this cohort, suggested by the overlapping female assistant professor (2,885) and female associate professors (2,921) in Figure 3, that starts around 1992.
[visualizer id=”45030″]
In Figure 5, the data backs up what academics already know: many professors are experiencing a long delay in joining the ranks of full-time faculty. Few have joined by the age of 39 (the average age of a person graduating with a PhD in Canada is 35) and around 2008, we see the beginning of an important change: the number of full-time professors aged 30-39 decreases to about 15 percent of total faculty in 2016 after holding steady at about 20 percent of total faculty from 2005-2008. Meanwhile, faculty members aged 60 and up, have been steadily rising in numbers. By 2016, the latter group experienced a bump to about 23 percent total faculty in that year (compared to about 18 percent in 2008).
Like the Canadian workforce in general, the professoriate is getting older – a trend that coincides with the loss of mandatory retirement.
[visualizer id=”45029″]
The overall greying of the professoriate is also reflected in Figure 6. The median age of full-time faculty increased to 51 in 2016 from 37 in 1970. At the assistant professor rank – generally considered “entry level” in the career of a tenured professor – the median age is now 39. It’s only a six-year difference from the median age of 33 in 1970, but it still suggests academics are getting on the tenure track a bit later in life. The rank below assistant, which presumably includes limited-term faculty postings and the like, has aged sharply: from a median age of 30 in 1970 to 49 by 2016. Along with that fact that “Other ranks” experienced the biggest jump, from 34 to 52, this may indicate that more academics are staying in posts that are full-time, but not necessarily on the tenure track.
What’s next?
Statistics Canada is set to release early data from the 2017-18 UCASS survey in April. The agency is currently exploring the feasibility of collecting part-time faculty data in future surveys, as well as data on race and other demographic categories.
We would like to thank Teresa Omiecinski of Statistics Canada, who provided earlier versions of these graphs, which University Affairs adapted for this article. Data for charts has been sourced from Statistics Canada, University and College Academic Staff System – Full-time Staff (CANSIM table 477-0018), as well as UCASS data provided by request to Universities Canada and shared with University Affairs.
More from Features
-

Northern Shift
The alarming rise of far-right movements in Canada.
-

How social movements shape Canadian universities
A history of clashes, challenges, and lessons learned.
-
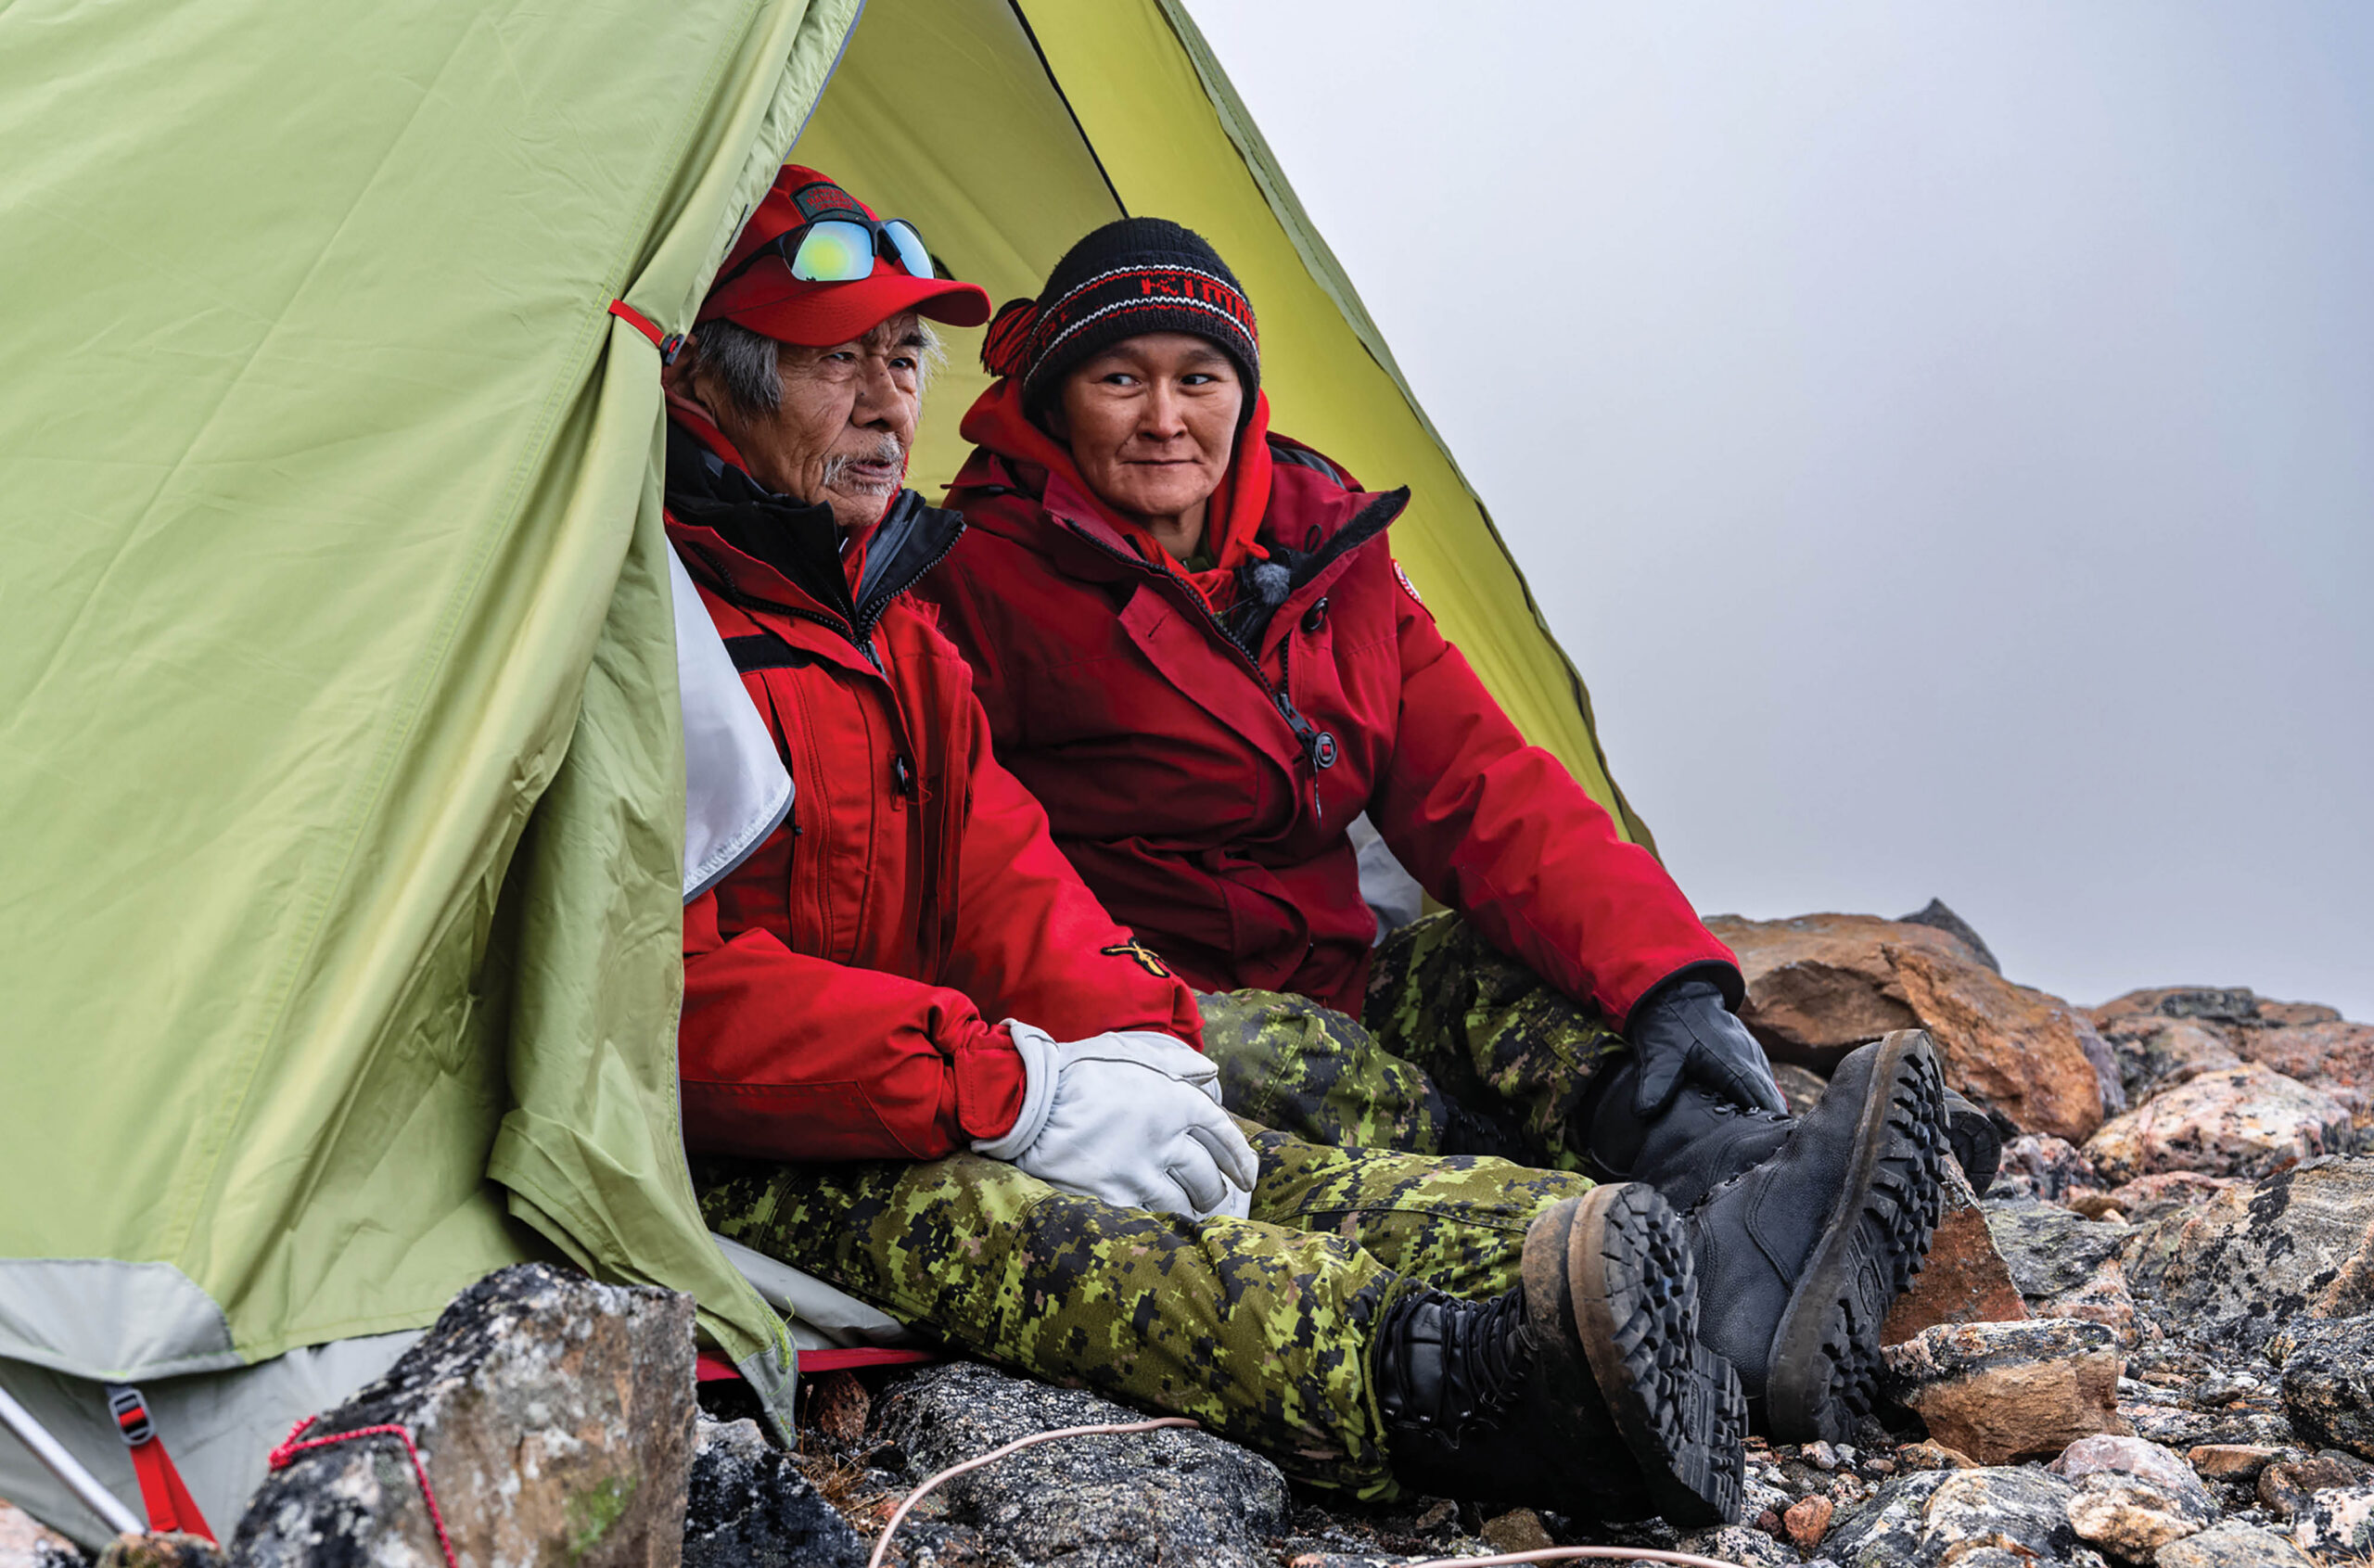
U the North
Working together with Inuit, First Nations and Métis, university researchers are bolstering sovereignty and improving living conditions in the Arctic.
-

Degrees of Change
British Columbia’s funding pressures, shifting enrolment and policy reforms signal sweeping changes ahead for colleges and universities across the province.
More from Teaching
-

Learning through community service
When students work with social organisms, everyone benefits.
-

What are universities really for and why does it matter now?
A review of Knowledge Under Siege: Charting a Future for Universities, University of Regina Press, 2026.
-

Reflection on five years of The Skills Agenda
Faculty innovation is key to advancing student career preparation in the years ahead.
-

Teaching physicians, med students battle Quebec’s Bill 2 with strikes and lawsuits
Students strive to make up for lost time after fall labour disruptions.
More from Feature articles
-
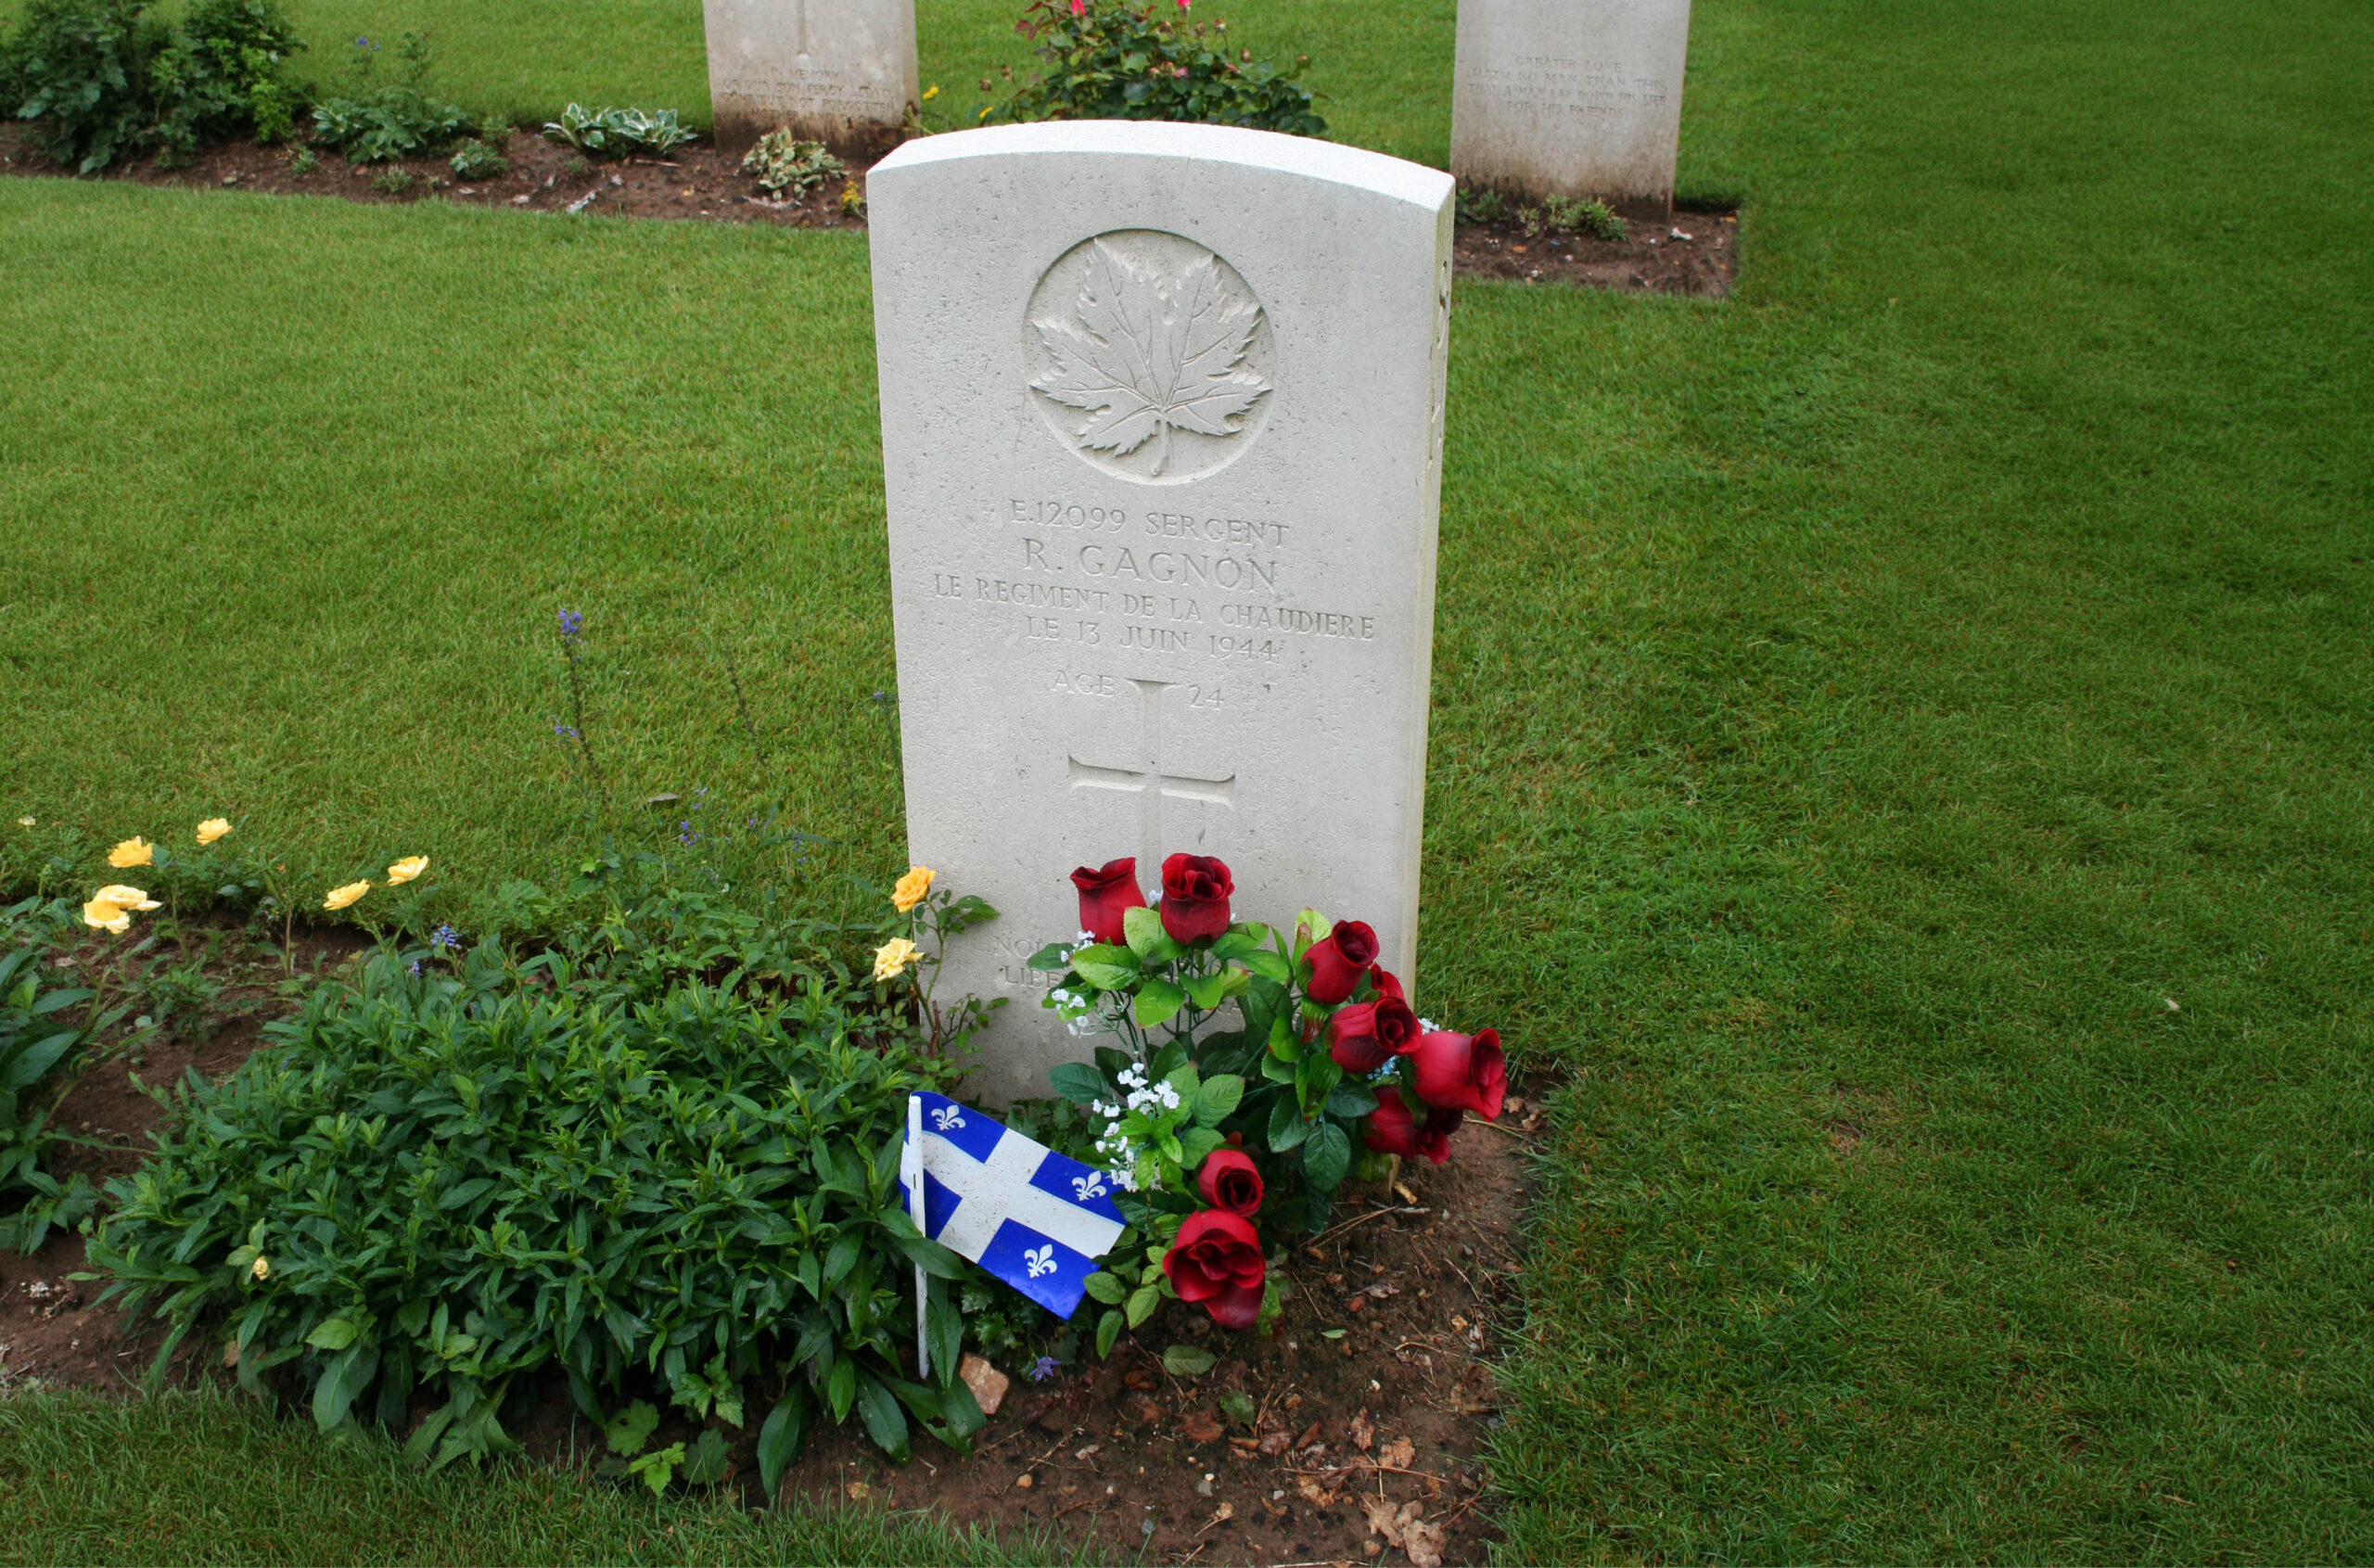
Two solitudes: Quebec Universities in WWII
Historical researcher explores English-French divide over Second World War.
-
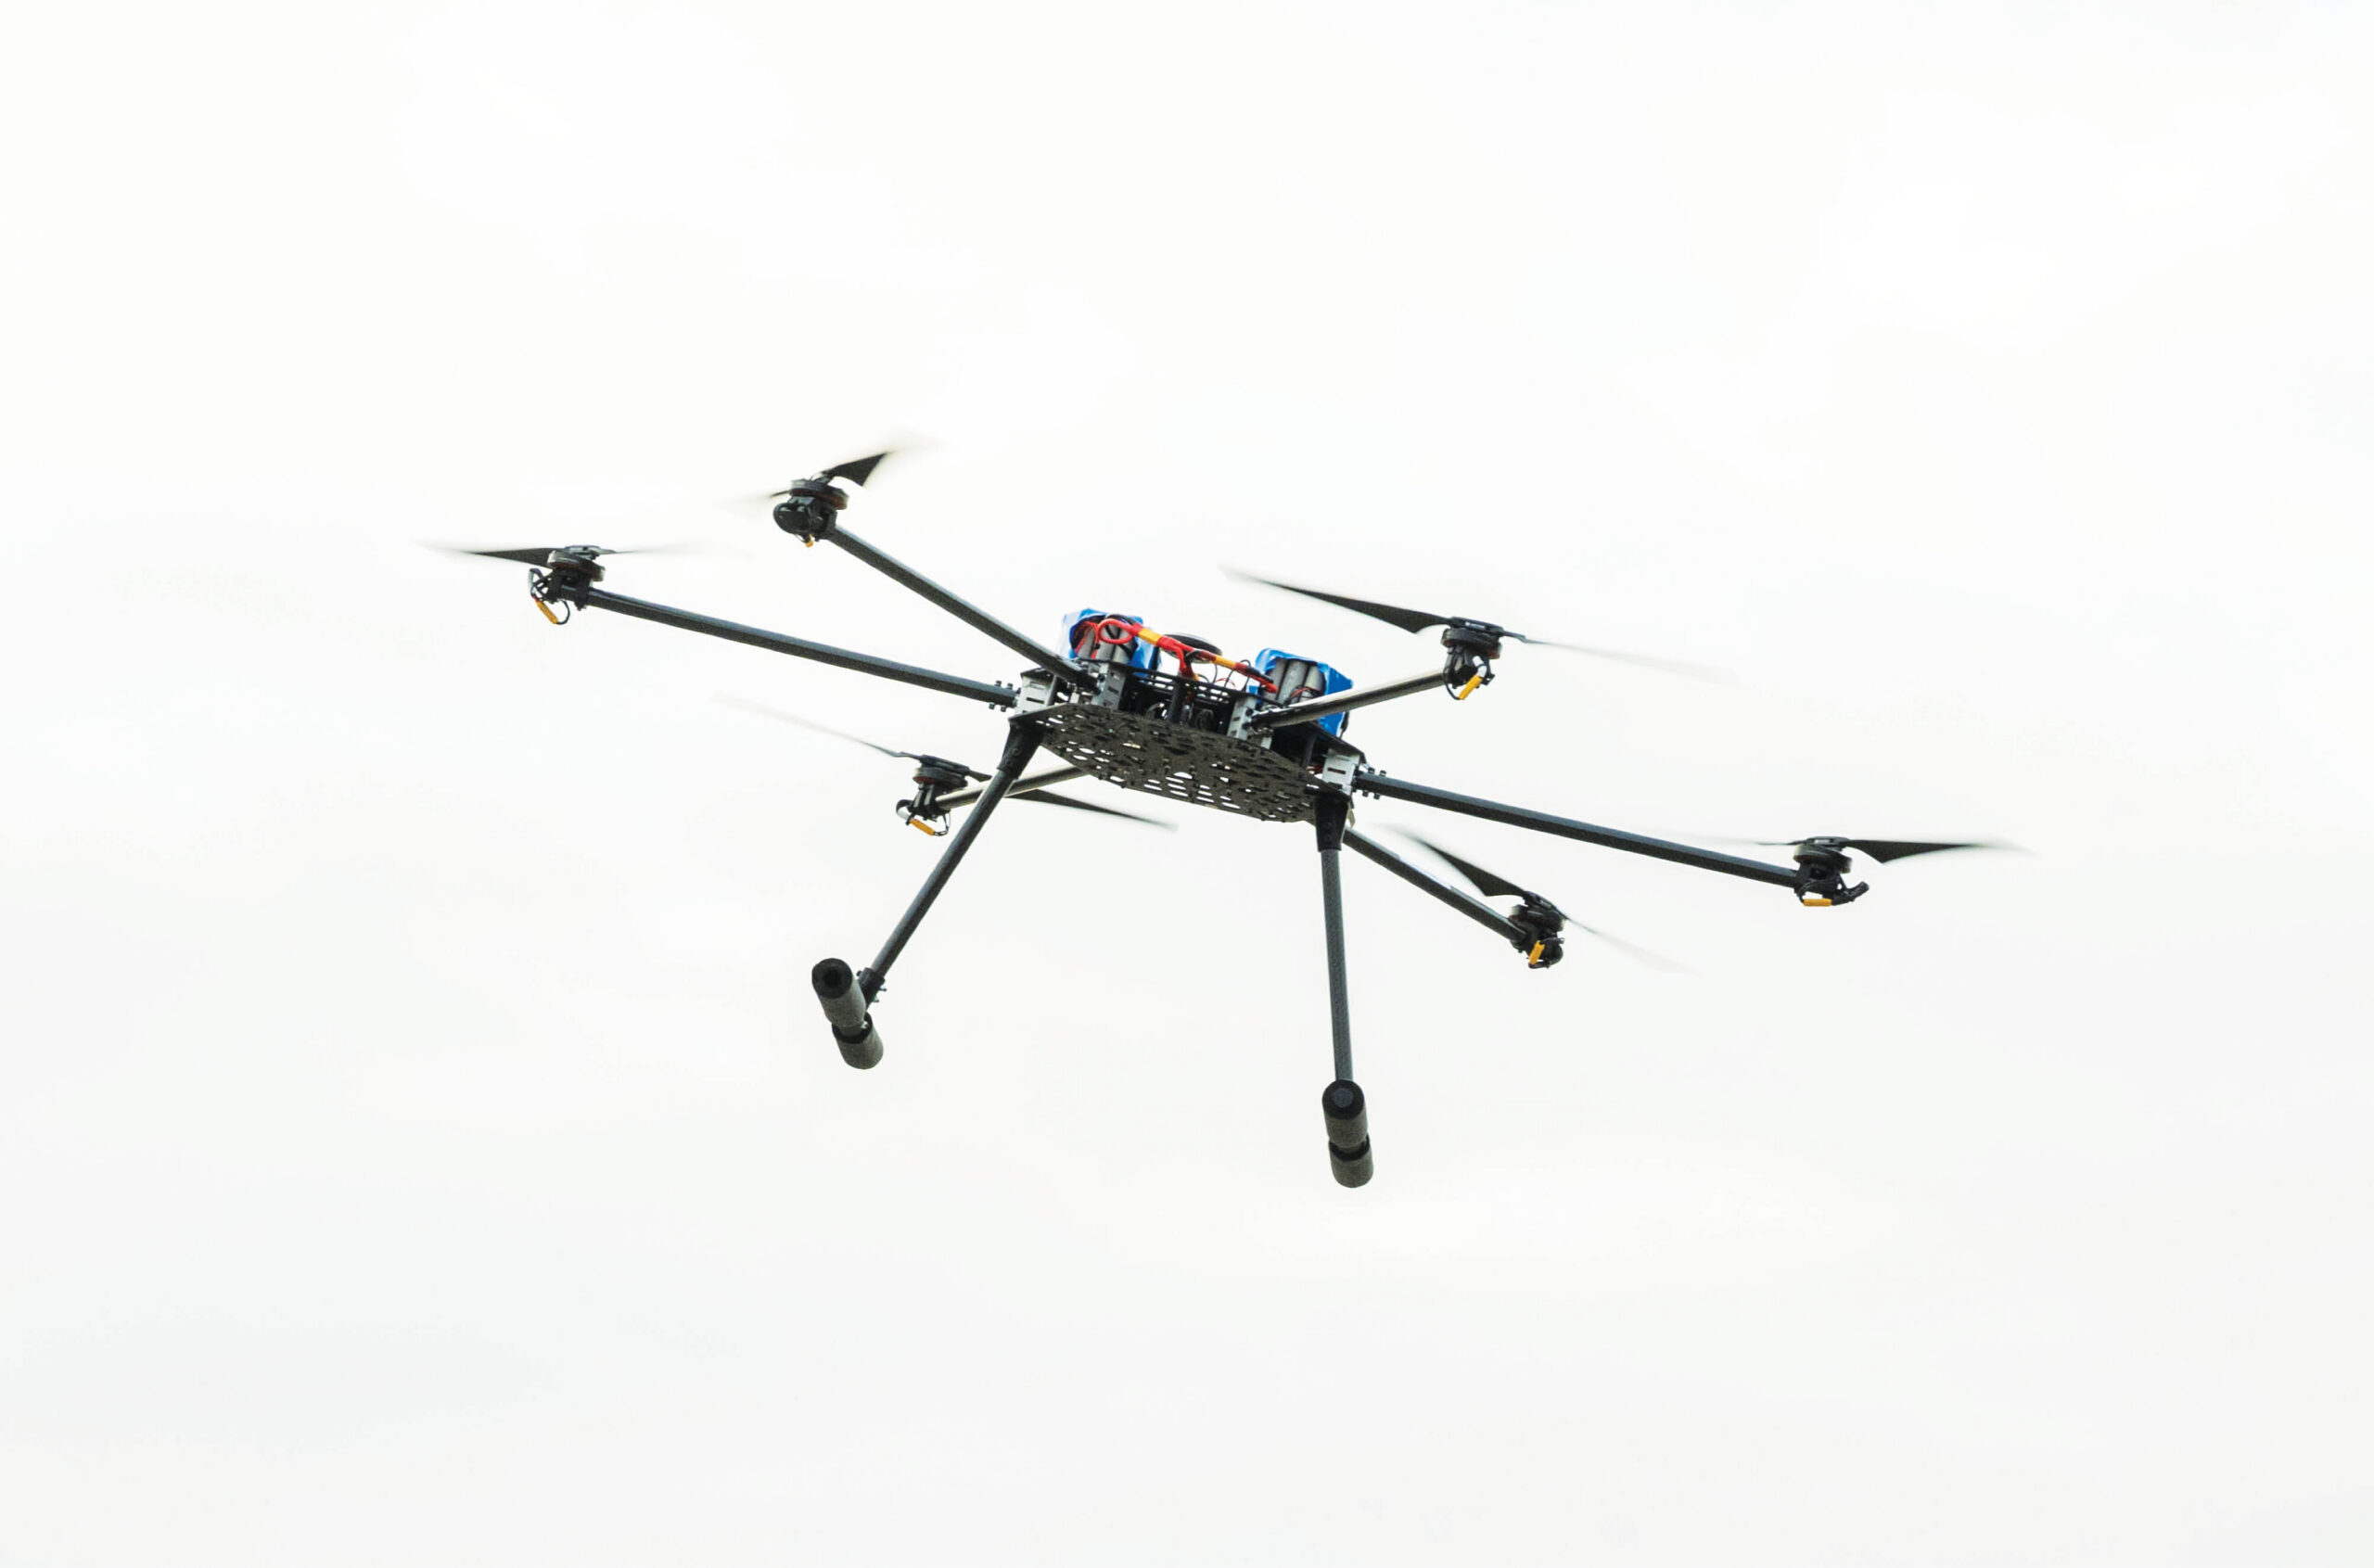
Flight of the Valkyrie
Waterloo engineering students compete for glory with an AI-enhanced urban firefighting drone.
-

Behind the curve
Learning to embed AI in the medical curriculum.
-

The grey area of artificial intelligence
As AI transforms university practices, legal and ethical challenges are multiplying.
Post a comment
University Affairs moderates all comments according to the following guidelines. If approved, comments generally appear within one business day. We may republish particularly insightful remarks in our print edition or elsewhere.
3 Comments
It would be interesting to see a graph showing PhD graduates and faculty recruitment for each year. We know that it has widened drastically.
It would be interesting to see the number of full professors who are over 65 (i.e. what used to be retirement age).
Any analysis as to why there are so few female profs making it to associate/full professor rank in comparison to the men? This seems like a significant issue to me.
Men still hold over three times the number of full time positions compared to women. Patriarchal thinking is still the norm in Canada. The vast majority of full time positions for women are in Nursing and Women’s Studies.